


Introduction
Retailers don’t install cameras for fun. They install computer vision because a CFO somewhere asked one blunt question: “When does this pay for itself?”
This guide answers that question with numbers, not marketing language. It breaks down computer vision retail roi into a repeatable framework, walks through a real 200-store deployment, and exposes the hidden costs that quietly kill payback timelines.
By the end, you’ll know how to calculate computer vision ROI in retail using a structure that finance teams actually trust.
What Computer Vision ROI Actually Means in Retail
Retail computer vision return on investment measures the financial payback a store network gets from deploying camera-based AI systems. It compares total investment (hardware, software, labor) against measurable financial gains (recovered sales, reduced shrinkage, labor savings).
Most vendors talk about “operational efficiency.” Finance teams don’t fund vague efficiency. They fund cash flow improvements they can track on a spreadsheet.
That’s why this framework splits ROI into three specific financial levers instead of one fuzzy metric.
Why Generic ROI Calculations Fail
Generic vendor pitches often bundle every benefit into a single “efficiency gain” percentage. That approach collapses under CFO scrutiny because it can’t be audited line by line.
A defensible retail AI vision cost-benefit analysis needs three qualities:
- Every gain traces back to a specific store process.
- Every cost traces back to a specific budget line (CapEx or OpEx).
- The payback period uses actual transaction and shrinkage data, not industry averages.
The Three-Pillar Retail CV Financial Impact Model
This is the core framework for calculating computer vision ROI in retail. It breaks total financial impact into three quantifiable levers.

Lever 1: Hard Revenue Recovery (Shelf Availability and Planograms)
Most retailers underestimate the cost of empty shelves. The system says stock exists. The shelf says otherwise. Retailers call this “phantom inventory,” and it silently erodes sales every single day.
Computer vision fixes this by detecting shelf gaps in real time and alerting staff before a customer walks away empty-handed.
Simplified recovery formula:
Lost Margin Recovered = (Reduced Out-of-Stock Hours × Average Hourly SKU Sales Rate × Gross Margin %) × Number of Affected SKUs
Even a modest reduction in stockout hours across thousands of SKUs adds up fast across a large store footprint.
Lever 2: Margin Protection (Loss Prevention and Shrinkage)
Self-checkout lanes lose retailers billions annually through mis-scans, ticket switching, and shelf-sweeping. Vision systems watch these lanes continuously and flag suspicious scan patterns instantly. For a deeper look at how these systems work in practice, see our guide to computer vision loss prevention.
This lever tracks three shrinkage sources directly:
- Mis-scan detection (barcode swapping, wrong-item scanning)
- Ticket switching (attaching a cheaper item’s barcode to an expensive item)
- Shelf-sweeping prevention (bulk theft during checkout distraction)
Self-checkout loss prevention AI ROI shows up fastest here because shrinkage reduction is easy to measure against historical baselines.
Lever 3: Labor Capital Optimization
Store staff spend hours walking aisles for manual cycle counts and visual stock checks. Computer vision automates that work, freeing staff for customer-facing tasks that actually drive sales.
This lever doesn’t cut headcount. It redirects labor hours toward higher-value activities like fulfillment and customer service, which indirectly boosts conversion.
| Financial Lever | Primary Metric Tracked | Typical Time to Measurable Impact |
| Hard Revenue Recovery | Out-of-stock event reduction | 2–4 months |
| Margin Protection | Shrinkage rate reduction | 3–5 months |
| Labor Capital Optimization | Hours redirected per store per week | 1–3 months |
Real-World Case Breakdown: A 200-Store Enterprise Rollout
Numbers convince finance teams faster than frameworks. Here’s a real deployment breakdown from a mid-sized grocery and general merchandise retailer.
Deployment Context
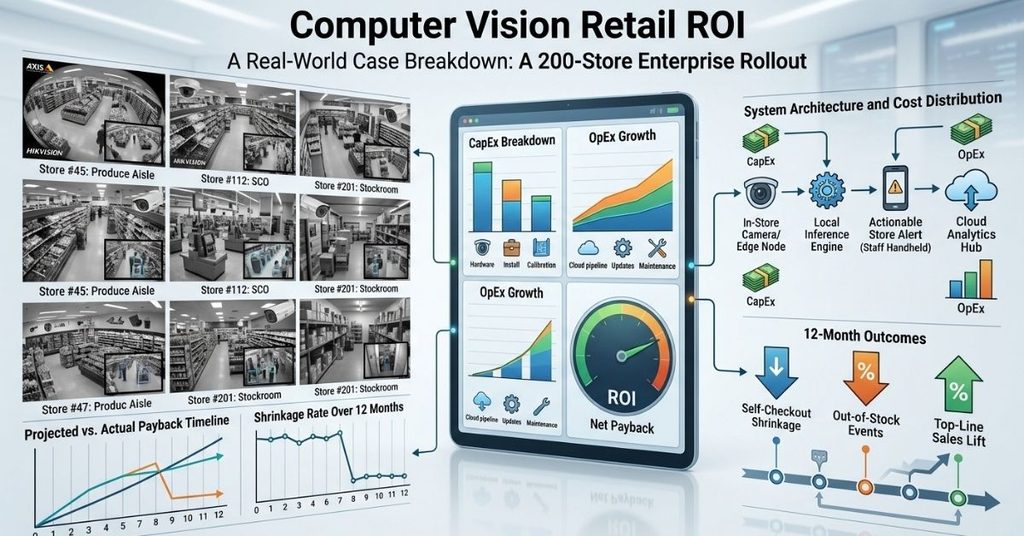
The retailer rolled out overhead vision sensors across 200 locations. Each store averaged 40,000 square feet. The goal: reduce self-checkout shrinkage and cut chronic out-of-stock events during peak shopping windows.
The Financial Breakdown
Capital Expenditure (CapEx) covered three components:
- Camera and edge processing node hardware
- Installation across all 200 locations
- Initial model calibration for each store layout
Operational Expenditure (OpEx) covered ongoing costs:
- Cloud annotation pipeline for continuous model improvement
- Periodic edge software updates
- System maintenance and camera servicing
12-Month Financial Outcomes
The results validated the three-pillar model in practice.
- Self-checkout shrinkage dropped 32% within month 4.
- Out-of-stock events during peak hours dropped 45%, driving a 3.8% top-line sales lift.
- The retailer hit net payback by month 8.4.
That payback timeline beat the retailer’s original 14-month projection by nearly six months, largely because shelf-availability gains compounded faster than the finance team expected.
System Architecture and Cost Distribution
Understanding where costs sit in the pipeline helps retailers budget accurately. The data flow moves through four stages:
In-Store Camera / Edge Node → Local Inference Engine → Actionable Store Alert (Staff Handheld) → Cloud Analytics Hub
CapEx concentrates at the camera and edge node stage. OpEx concentrates at the cloud analytics stage, where ongoing compute and storage costs accumulate.
The Hidden Costs That Kill Vision ROI
Roughly 40% of retail computer vision pilots never reach full-deployment ROI. The reasons rarely show up in vendor sales decks.
Lighting and Occlusion Factors
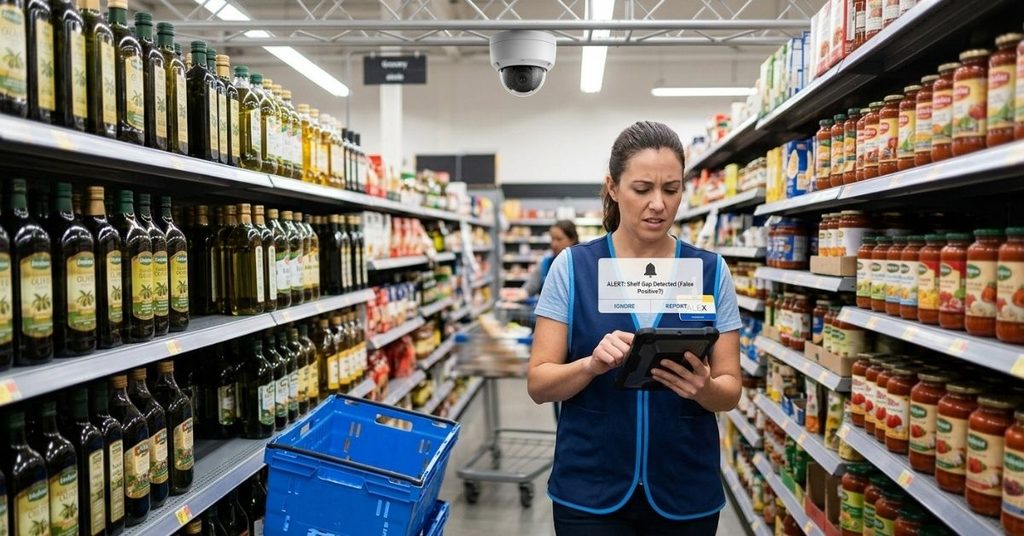
Store environments change constantly. Overhead lighting shifts throughout the day. Aisles get crowded during peak hours. Both factors hurt object detection accuracy, measured through mean average precision (mAP).
Lower mAP means more false-positive alerts. Store staff start ignoring alerts after enough false alarms, which quietly kills the entire system’s usefulness. This “alert fatigue” problem sinks more pilots than any hardware failure.
Camera Density Miscalculations
Retailers often over-specify camera resolution, assuming higher quality always helps. Choosing 4K streams over 1080p can explode bandwidth and cloud compute budgets by up to 300%, without a proportional accuracy gain.
The right resolution depends on the detection task, not on maximizing pixel count. Shelf-gap detection rarely needs 4K. Facial-adjacent analytics might.
Annotation and Retraining Overhead
Product packaging changes constantly. New promotions, seasonal redesigns, and supplier updates all shift how products look to a trained model. This creates “model drift,” where detection accuracy degrades over time.
Retailers must budget for ongoing annotation and retraining work. Skipping this step is the single most common reason a system that worked great in month one fails by month six.
Quick Reference: Common Pitfalls and Fixes
| Hidden Cost | Root Cause | Practical Fix |
| Alert fatigue | Poor lighting/occlusion handling | Calibrate models per store, not globally |
| Bandwidth overruns | Over-specified camera resolution | Match resolution to detection task |
| Model drift | Unbudgeted retraining cycles | Set a fixed quarterly retraining schedule |
| Slow payback | Vague ROI tracking | Use the three-pillar model with hard metrics |
Edge AI vs. Cloud Processing: Cost and Latency Trade-Offs
Retailers face a core infrastructure decision: process video locally at the edge, or stream it to the cloud for processing.
Edge Processing
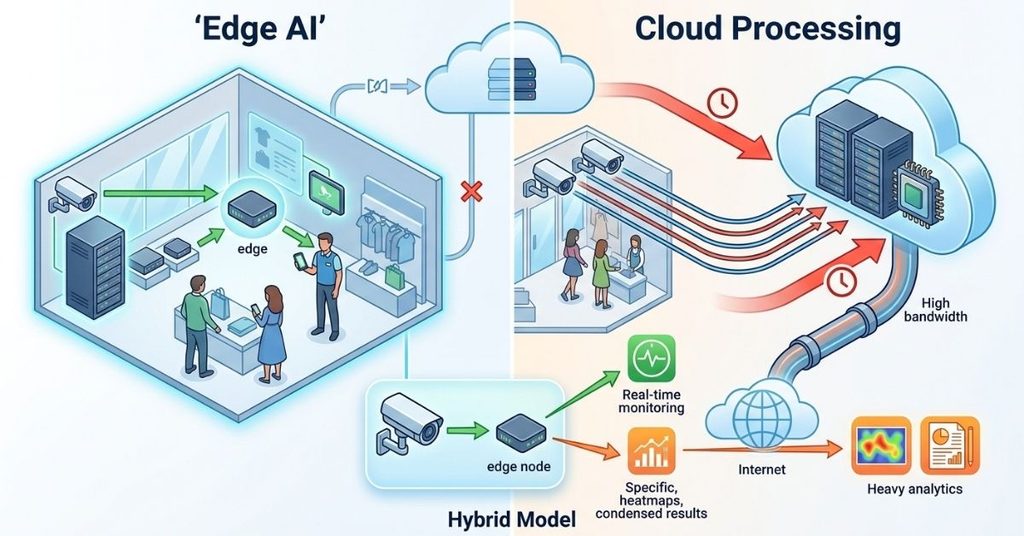
Edge AI runs inference directly on in-store hardware. This cuts bandwidth costs dramatically and delivers near-instant alerts to staff handhelds. The trade-off: higher upfront hardware costs per location.
Cloud Processing
Cloud processing centralizes compute, which lowers per-store hardware costs. The trade-off: continuous video streaming consumes massive bandwidth, and latency increases, which delays time-sensitive alerts like self-checkout fraud detection.
Most successful large-scale deployments use a hybrid model. Edge nodes handle time-sensitive detection (self-checkout, shelf gaps). Cloud infrastructure handles heavier analytics like long-term heatmap trends and planogram compliance reporting.
Store Heatmaps and Planogram Compliance
Beyond raw detection, computer vision generates spatial heatmaps showing customer dwell time and movement patterns across a store.
Layering this against planogram compliance data reveals where SKU gaps and misplacements actually cost sales, not just where they technically exist. A misplaced item in a low-traffic corner matters far less than one in a high-dwell-time endcap.
This combination turns raw detection data into a prioritized action list for store staff, rather than an overwhelming flood of alerts.
Estimating Camera Deployment Costs Per Square Foot
Retailers frequently ask how to budget deployment costs before committing to a full rollout. A rough per-square-foot estimate needs three inputs:
- Store square footage and layout complexity
- Target camera density (coverage overlap requirements)
- Edge vs. cloud processing choice (affects hardware cost per node)
Smaller format stores often see higher relative deployment costs, since fixed installation and calibration costs don’t scale down proportionally with square footage.
How Long Does It Take to See ROI from Retail Computer Vision?
Based on real deployment data, most retailers see measurable financial impact within 3 to 5 months. Full payback typically lands between 8 and 14 months, depending on store count, shrinkage baseline, and deployment quality.
Retailers with clean lighting infrastructure, accurate camera density planning, and a disciplined retraining schedule consistently land toward the faster end of that range.
Frequently Asked Questions
How is retail computer vision ROI different from general retail AI ROI?
Retail computer vision ROI focuses specifically on camera-based detection systems: shelf monitoring, self-checkout analytics, and spatial heatmaps. General retail AI ROI can include unrelated categories like chatbots or demand forecasting, which follow different cost and payback structures.
What’s a realistic payback period for computer vision in retail?
Most well-executed deployments reach payback between 8 and 14 months. The 200-store case study in this guide hit payback at month 8.4, driven by strong shrinkage reduction and out-of-stock recovery.
Does higher camera resolution always improve ROI?
No. Over-specifying resolution, such as choosing 4K over 1080p unnecessarily, can inflate bandwidth and cloud compute costs by up to 300% without improving detection accuracy for most retail use cases.
What causes computer vision pilots to fail before reaching full ROI?
The most common causes include alert fatigue from poor lighting calibration, budget overruns from camera over-specification, and unbudgeted model retraining as product packaging changes over time.
Should retailers choose edge processing or cloud processing?
Most large-scale retailers use a hybrid approach. Edge processing handles time-sensitive alerts like self-checkout fraud. Cloud processing handles heavier, less time-sensitive analytics like long-term heatmap trends.
How do I calculate the financial value of reduced out-of-stock events?
Multiply the reduction in out-of-stock hours by the average hourly sales rate for affected SKUs, then apply the gross margin percentage. Scale that figure across all SKUs affected by the vision system’s shelf-monitoring coverage.
Conclusion
Computer vision retail roi isn’t a mystery once you break it into measurable pieces. The three-pillar model- hard revenue recovery, margin protection, and labor capital optimization- gives finance teams the specific numbers they need to approve and track an investment.
The 200-store case study proves the model works in practice, with payback achieved in just over eight months. But that outcome only happens when retailers avoid the hidden cost traps: poor lighting calibration, over-specified camera resolution, and neglected model retraining.
Get those fundamentals right, and computer vision stops being an experimental cost center. It becomes one of the fastest-paying-back investments in the physical retail stack.

I’m Qasim Ali, the Founder and Technology Writer at TechRised, with 10+ years of experience and a strong academic background in technology and emerging digital innovations. My expertise spans Generative AI, AI Automation, Robotics, Computer Vision, and Machine Learning. I specialize in researching emerging technologies, analyzing industry trends, and transforming complex technical concepts into clear, practical, and reliable insights. Through TechRised, I share research-driven content to help readers understand the latest advancements in AI and the technologies shaping the future.